
In short
A useful SQL Server performance baseline answers one question before you change anything: what was the database and server doing while the workload was healthy, slow, or under peak load?
For SQL Server 2025 on Windows Server, combine four evidence sources:
- Query Store — which queries ran, which plans they used, and how runtime behavior changed over time.
- Query Store wait statistics — which wait categories were associated with specific queries.
- Instance-level waits and SQL Server performance counters — what the Database Engine was waiting for and how SQL memory/engine counters behaved.
- Windows PerfMon — whether CPU, available memory, disk activity, or other Windows resource signals moved at the same time.
Use the baseline before changing max server memory, adding TempDB files, forcing a query plan, changing indexes, or resizing the VM. One high CPU screenshot or one wait type is not enough evidence for a production change.
This guide owns database-level SQL Server performance baseline and Query Store diagnostics. For the operating-system-level CPU, RAM, disk, and network baseline, use Windows Server Performance Monitoring: CPU, RAM, Disk, and Network.
Tested on Raff
We validated the workflow in this guide on a Raff Windows VM on 2026-08-29.
| Item | Test environment |
|---|---|
| Provider | Raff Technologies |
| Windows | Windows Server 2025 Standard Evaluation |
| Windows build | 26100 |
| SQL Server | SQL Server 2025 Developer, 17.0.1000.7 RTM |
| SQL instance | MSSQLSERVER |
| Test database | RaffPerfTest |
| Connection tooling | Microsoft sqlcmd v1.10.0 |
| Workload | Controlled synthetic test workload |
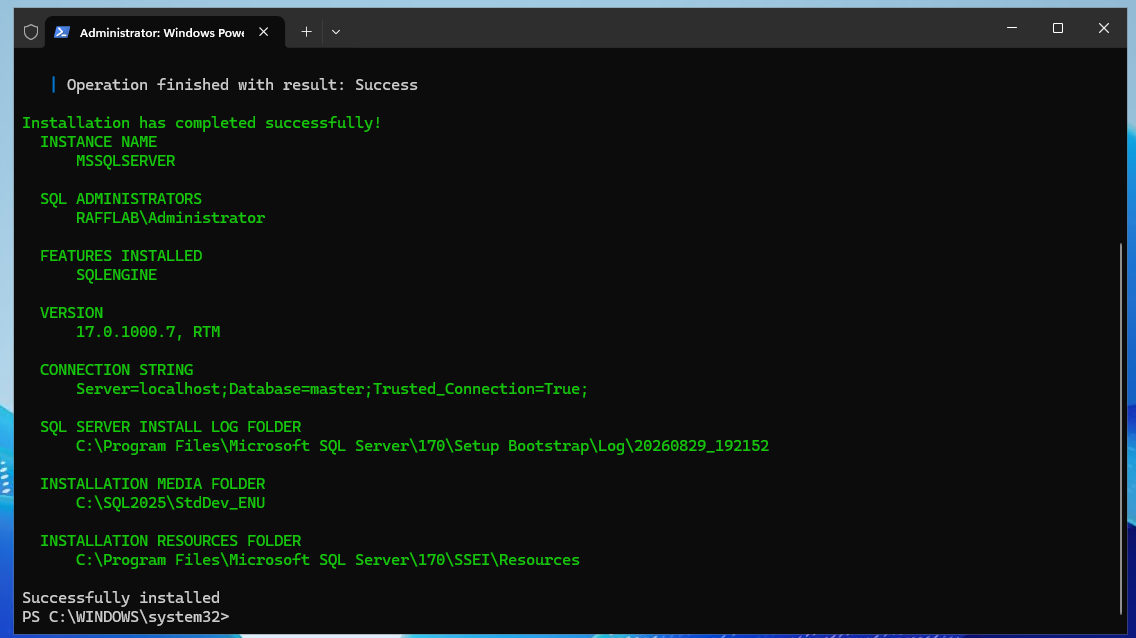
SQL Server 2025 Developer installation completed successfully on the Raff Windows Server 2025 test VM.
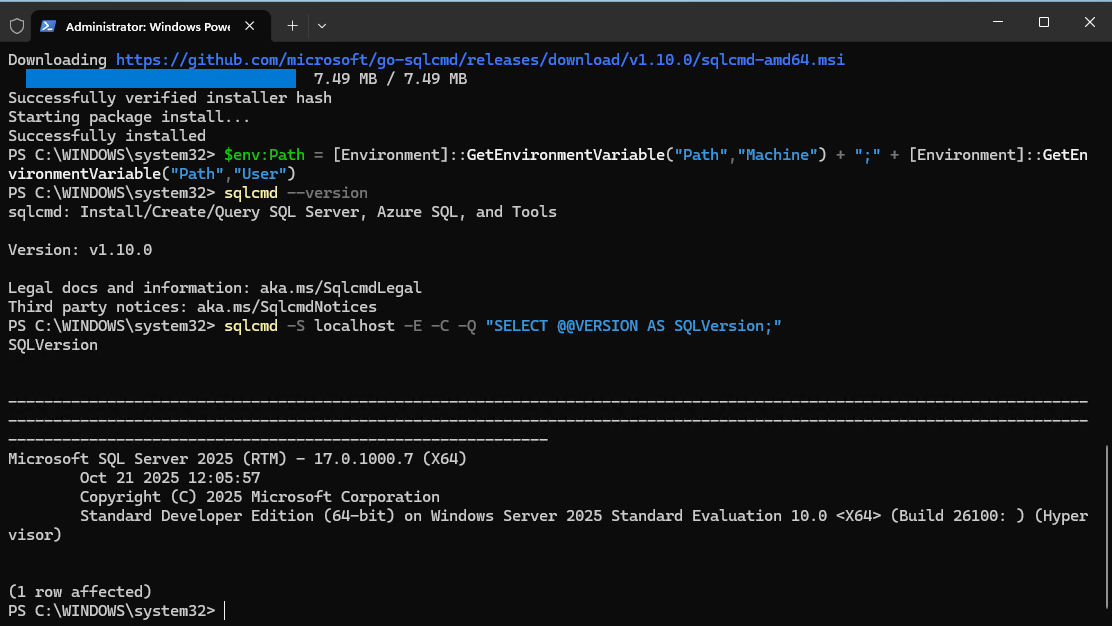
SQL Server 2025 version and instance verification from the Raff lab environment.
We verified:
- SQL Server 2025 installation and local trusted connection;
- Query Store in
READ_WRITEstate; - Query Store wait-stat capture enabled;
- Top Query Store runtime statistics from the controlled workload;
- Query Store wait categories including Buffer IO, CPU, Memory, Transaction Log IO, and Other Disk IO;
- instance-level waits from
sys.dm_os_wait_stats; - a real
LCK_M_Xwait created with a controlled short blocking test; - SQL Server performance counters including Page Life Expectancy, Total Server Memory, Target Server Memory, and User Connections;
- Windows Performance Monitor collection during the test window.
The test validates the procedure, not production performance. The workload was synthetic and the results are not a Raff benchmark or sizing claim.
One detail matters for reproducing the lab evidence: our captured PerfMon screen used CPU, Available MBytes, and disk I/O byte counters. For actual disk-latency analysis, this guide recommends Avg. Disk sec/Read and Avg. Disk sec/Write; those specific latency counters were not benchmarked in this test.
What a SQL Server baseline should capture
A baseline is not a list of universal “good” numbers. It is a repeatable measurement of your own workload under known conditions.
Capture at least three periods when possible:
| Period | Why it matters |
|---|---|
| Normal business load | Shows the server’s ordinary operating pattern |
| Known peak workload | Shows what changes when concurrency, reports, imports, or jobs increase |
| Reported slow period | Lets you correlate user complaints with query, wait, and OS evidence |
For each period, record:
- database name and SQL Server version;
- timestamp and workload description;
- top Query Store queries by duration, CPU, reads, or executions;
- regressed queries or plan changes;
- Query Store wait categories;
- instance-level wait statistics;
- SQL Server memory/performance counters relevant to the problem;
- Windows CPU, available memory, and disk activity/latency;
- any backup, index maintenance, reporting, antivirus, or application job running at the same time.
The goal is correlation. A slow query plus storage waits plus increased disk latency is more useful than any one metric alone.
Query Store is the starting point for database-level evidence
Query Store persists query text, execution plans, and runtime statistics inside each user database. Starting with SQL Server 2017, Query Store can also capture wait statistics per query over time.
Starting with SQL Server 2022, Query Store is enabled by default for newly created databases. Do not assume that means every database on a SQL Server 2025 instance is collecting data: restored, upgraded, migrated, or intentionally reconfigured databases can have different states.
Check the actual state before troubleshooting.
Step 1 — Verify Query Store state and storage health
Run the following in the user database you want to monitor:
SELECT
    actual_state_desc,
    desired_state_desc,
    readonly_reason,
    current_storage_size_mb,
    max_storage_size_mb,
    query_capture_mode_desc,
    wait_stats_capture_mode_desc
FROM sys.database_query_store_options;
Review these fields first:
| Field | What to check |
|---|---|
actual_state_desc | Whether Query Store is actually collecting or is read-only/off |
desired_state_desc | What state SQL Server is configured to use |
readonly_reason | Why collection became read-only when actual and desired states differ |
current_storage_size_mb | Current Query Store space usage |
max_storage_size_mb | Configured storage ceiling |
query_capture_mode_desc | Which queries are being captured |
wait_stats_capture_mode_desc | Whether per-query wait statistics are being captured |
In our Raff lab, Query Store returned READ_WRITE, the desired state was READ_WRITE, capture mode was AUTO, and wait-stat capture was ON.
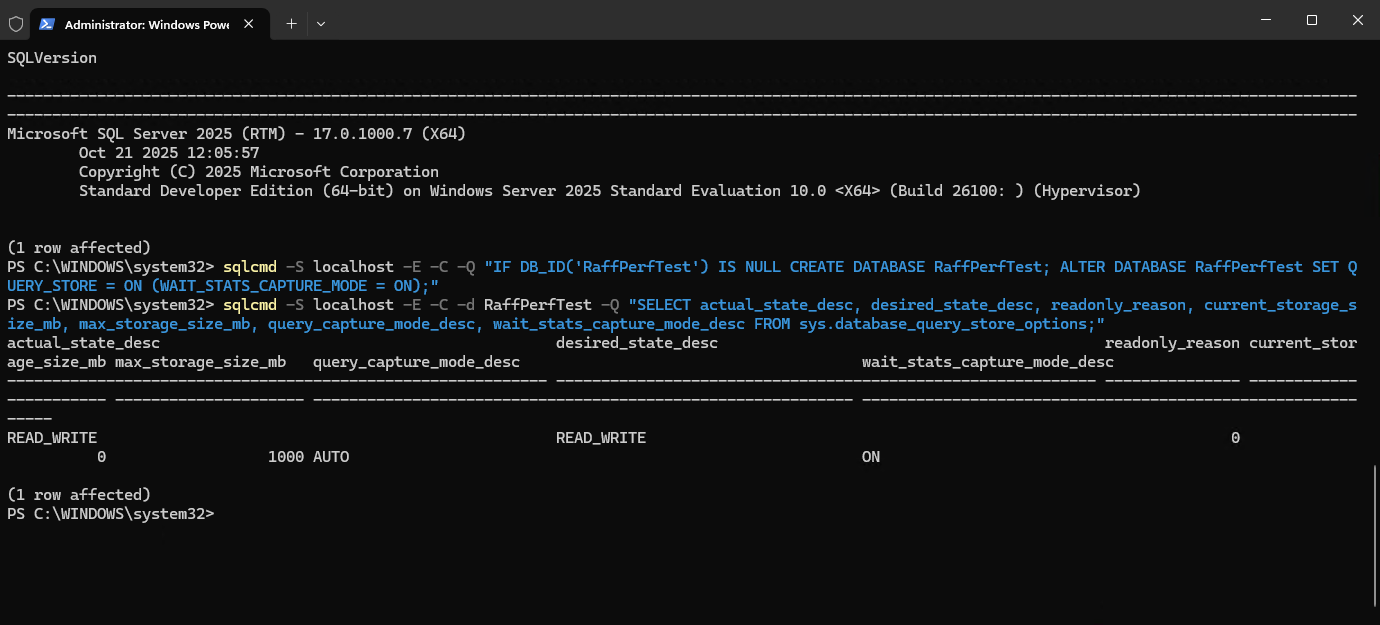
Query Store running in READ_WRITE mode with wait-stat capture enabled on the Raff SQL Server 2025 test database.
Microsoft recommends checking sys.database_query_store_options when Query Store appears to have stopped collecting data. Reaching the configured storage limit can make Query Store read-only.
Step 2 — Enable Query Store wait-stat capture when required
If the database is not using Query Store or wait-stat capture is disabled, review the environment before changing it.
Microsoft documents this configuration pattern:
ALTER DATABASE [YourDatabase]
SET QUERY_STORE = ON (
    WAIT_STATS_CAPTURE_MODE = ON
);
Replace [YourDatabase] with the real test or production database name.
Do not copy configuration changes into production only because a tutorial says to. First verify:
- Query Store is appropriate for the database and SQL Server version;
- enough Query Store storage is available;
- the database is not already governed by an organizational SQL configuration standard;
- the change is made during a controlled administration window when required by your process.
After any change, re-run sys.database_query_store_options and confirm the actual state.
Step 3 — Find top resource-consuming queries
SQL Server Management Studio exposes built-in Query Store reports such as:
- Top Resource Consuming Queries;
- Regressed Queries;
- Query Wait Statistics;
- Tracked Queries;
- Overall Resource Consumption.
You can also query Query Store directly. A practical baseline query is:
SELECT TOP (10)
    q.query_id,
    SUM(rs.count_executions) AS executions,
    CAST(
        SUM(rs.avg_duration * rs.count_executions)
        / NULLIF(SUM(rs.count_executions), 0)
        / 1000.0 AS decimal(12,2)
    ) AS avg_duration_ms,
    CAST(
        SUM(rs.avg_cpu_time * rs.count_executions)
        / NULLIF(SUM(rs.count_executions), 0)
        / 1000.0 AS decimal(12,2)
    ) AS avg_cpu_ms,
    LEFT(REPLACE(REPLACE(qt.query_sql_text, CHAR(13), ' '), CHAR(10), ' '), 70) AS query_text
FROM sys.query_store_query_text AS qt
JOIN sys.query_store_query AS q
    ON qt.query_text_id = q.query_text_id
JOIN sys.query_store_plan AS p
    ON q.query_id = p.query_id
JOIN sys.query_store_runtime_stats AS rs
    ON p.plan_id = rs.plan_id
GROUP BY q.query_id, qt.query_sql_text
ORDER BY avg_duration_ms DESC;
In the controlled Raff workload, this returned the data-generation query and repeated test queries with execution count, average duration, and average CPU time. That confirmed Query Store was capturing runtime evidence as expected.
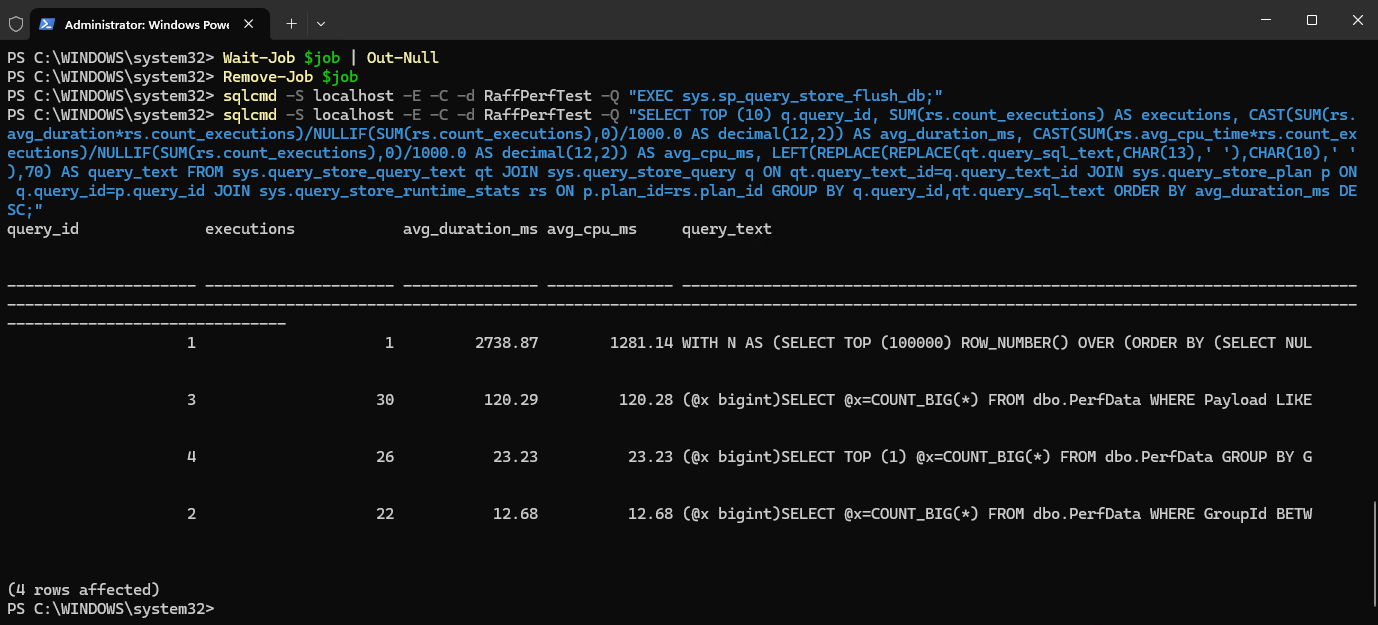
Top Query Store runtime results from the controlled Raff SQL Server 2025 workload.
For a real incident, change the sort metric depending on the problem: duration, CPU, logical reads, memory consumption, or execution count can tell different stories.
Use Regressed Queries when a workload that used to perform well has become slower. A regression can be query-plan related even when the VM itself still has available CPU and memory.
Step 4 — Use Query Store wait statistics to connect waits to queries
Instance-wide wait statistics can tell you what SQL Server has been waiting for, but they do not automatically tell you which query created that wait pattern.
Query Store helps close that gap because wait statistics can be associated with stored query plans over time.
A useful query is:
SELECT TOP (10)
    q.query_id,
    ws.wait_category_desc,
    CAST(SUM(ws.total_query_wait_time_ms) AS decimal(12,2)) AS total_wait_ms,
    LEFT(REPLACE(REPLACE(qt.query_sql_text, CHAR(13), ' '), CHAR(10), ' '), 65) AS query_text
FROM sys.query_store_wait_stats AS ws
JOIN sys.query_store_plan AS p
    ON ws.plan_id = p.plan_id
JOIN sys.query_store_query AS q
    ON p.query_id = q.query_id
JOIN sys.query_store_query_text AS qt
    ON q.query_text_id = qt.query_text_id
GROUP BY q.query_id, ws.wait_category_desc, qt.query_sql_text
ORDER BY total_wait_ms DESC;
Our test produced Query Store wait categories including:
- Buffer IO;
- Preemptive;
- Memory;
- CPU;
- Transaction Log IO;
- Other Disk IO.
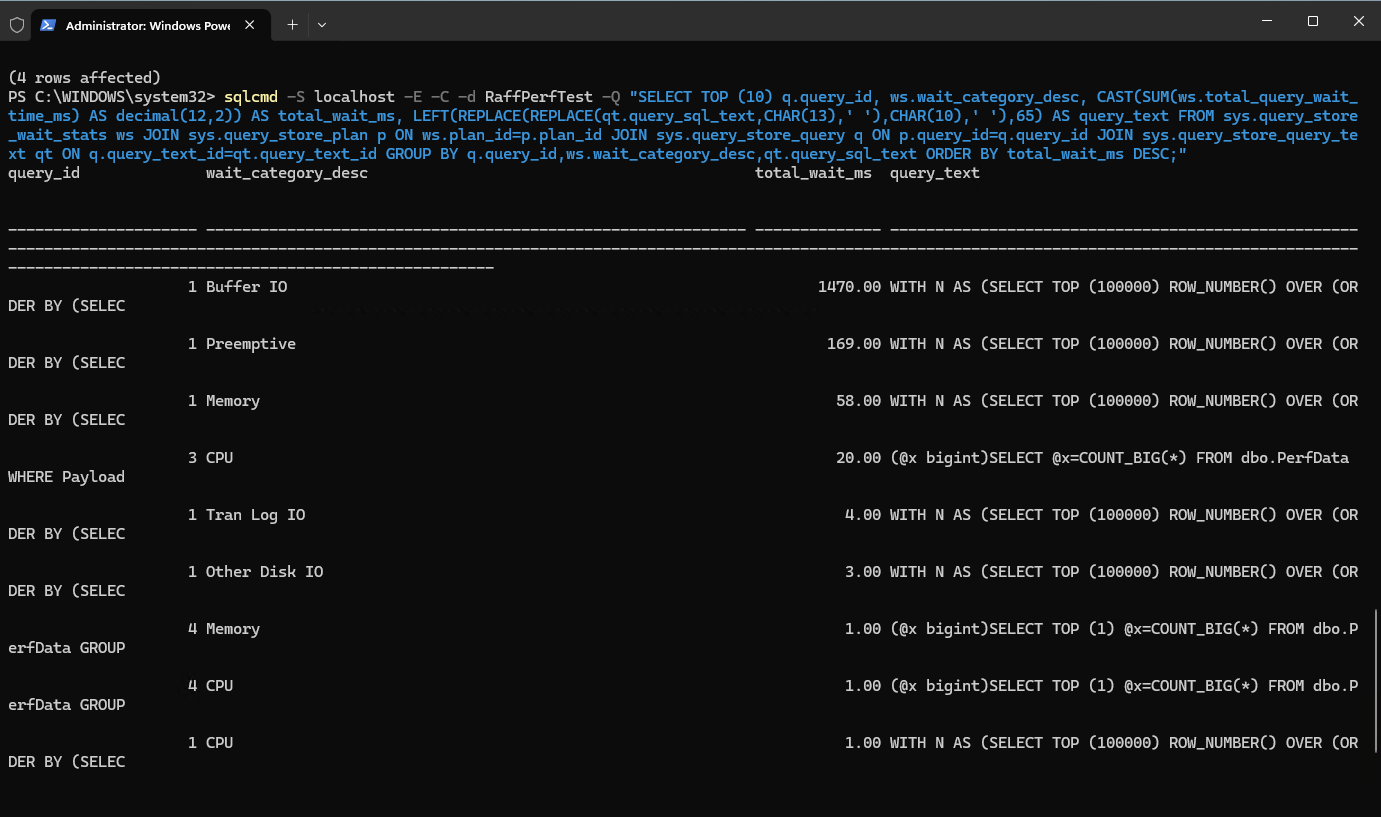
Query Store wait categories captured from the controlled Raff SQL Server 2025 test workload.
This is a starting point, not an automatic diagnosis. A high wait category tells you where to investigate; it does not prove the root cause by itself.
Step 5 — Review instance-level wait stats in context
For the SQL Server instance, review sys.dm_os_wait_stats:
SELECT TOP (20)
    wait_type,
    waiting_tasks_count,
    wait_time_ms,
    signal_wait_time_ms,
    wait_time_ms - signal_wait_time_ms AS resource_wait_time_ms
FROM sys.dm_os_wait_stats
ORDER BY wait_time_ms DESC;
The important limitation is that these values are cumulative. They reflect waits accumulated since the SQL Server service started or since the wait statistics were explicitly cleared.
That means this is weak evidence:
One query of sys.dm_os_wait_stats
→ one large wait type
→ immediate configuration change
A stronger workflow is:
Record wait stats at baseline start
→ run or observe a known workload window
→ record again
→ compare the change
→ correlate with Query Store and Windows metrics
Controlled blocking test used in the Raff lab
To verify that a real lock wait appeared in sys.dm_os_wait_stats, we used a short controlled transaction in the test database. One session held a row update for roughly 12 seconds while a second update attempted to access the same row.
The resulting wait statistics included LCK_M_X with approximately 10 seconds of resource wait time. This was an intentional lab condition, not a production incident.
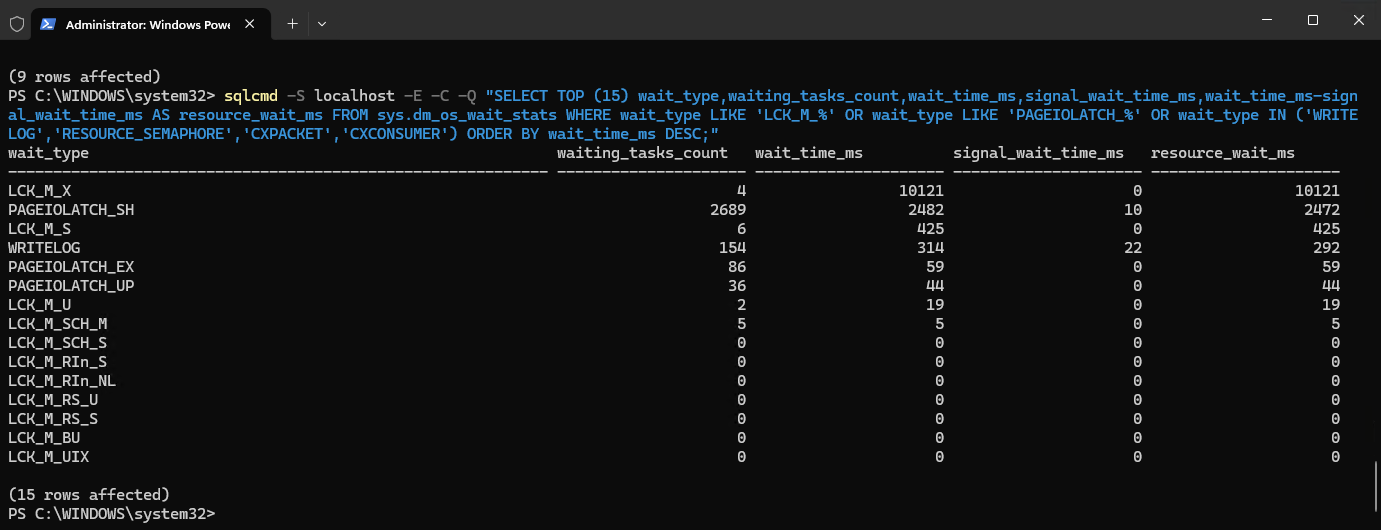
Instance-level wait statistics from the Raff lab, including the intentionally generated LCK_M_X wait.
Do not create blocking deliberately on a production database just to validate monitoring.
What common wait categories can suggest
Use wait evidence as a direction for investigation, not as a final diagnosis.
| Evidence pattern | Investigate next |
|---|---|
| Query Store shows CPU-heavy queries and Windows CPU rises at the same time | Query plan, scans, parallelism, application workload, then CPU sizing |
| Page I/O-related waits rise and Windows disk latency also rises | Query access pattern, indexes, storage activity, backup/report overlap |
| Memory-grant-related waits increase | Query memory grants, concurrency, execution plans, available SQL/Windows memory |
| Lock-related waits rise | Blocking chains, transaction duration, application transaction design |
| Log-write-related waits rise | Transaction log activity, storage latency, transaction pattern |
| TempDB-related contention evidence appears | TempDB usage and configuration, then the dedicated TempDB guide |
| Network-related waits appear without VM saturation | Client/application consumption rate, network path, result-set size |
The same wait type can have different causes. Always combine waits with query and operating-system evidence.
Step 6 — Add SQL Server performance counters
SQL Server exposes engine counters through Windows Performance Monitor and through sys.dm_os_performance_counters.
For a first SQL baseline, inspect a small set rather than collecting every counter available.
Example:
SELECT
    object_name,
    counter_name,
    instance_name,
    cntr_value,
    cntr_type
FROM sys.dm_os_performance_counters
WHERE counter_name IN (
    'Page life expectancy',
    'Total Server Memory (KB)',
    'Target Server Memory (KB)',
    'User Connections'
)
ORDER BY object_name, counter_name, instance_name;
In our Raff lab, the query returned the expected SQL Server Buffer Manager, General Statistics, and Memory Manager counters.
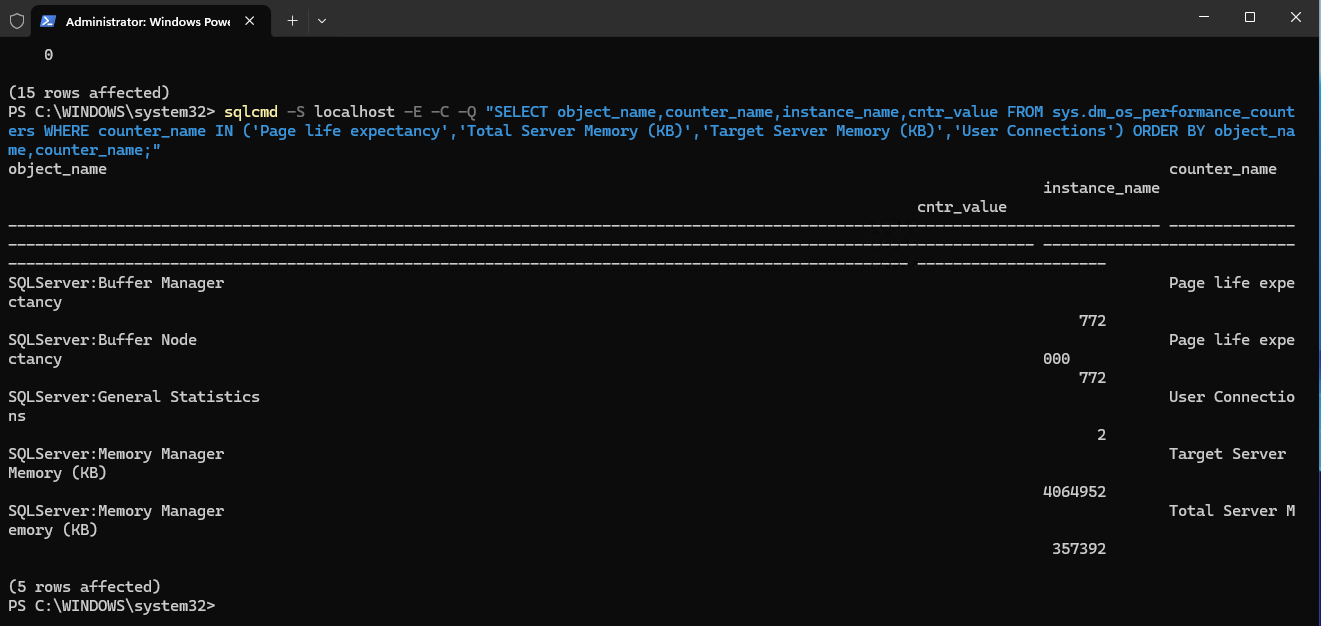
SQL Server memory, connection, and buffer counters captured during the Raff baseline test.
Use these as supporting signals:
- Total Server Memory / Target Server Memory helps explain SQL Server memory allocation behavior;
- Page life expectancy can be trended as one memory/cache signal, but should not be judged by one universal threshold;
- User Connections helps put resource use in concurrency context.
For rate counters such as requests per second, sample over a defined interval or use PerfMon rather than treating one raw DMV value as a ready-made rate.
Microsoft also exposes a dedicated SQLServer:Wait Statistics performance object with counters for categories such as lock waits, log write waits, memory grant queue waits, network I/O waits, page I/O latch waits, and worker waits.
Step 7 — Correlate SQL evidence with Windows PerfMon
SQL Server runs inside Windows. Database evidence becomes much stronger when it matches what the operating system was doing at the same time.
For the Windows-side baseline, start with:
| Windows counter | What it helps answer |
|---|---|
Processor(_Total)\% Processor Time | Was the VM CPU actually saturated during the slow period? |
Memory\Available MBytes | Did Windows have usable memory headroom? |
PhysicalDisk(_Total)\Avg. Disk sec/Read | Did read latency increase? |
PhysicalDisk(_Total)\Avg. Disk sec/Write | Did write latency increase? |
Network Interface(*)\Bytes Total/sec | Did network throughput change materially? |
During our controlled Raff test, we verified PerfMon collection for CPU, available memory, and disk I/O activity. For production latency analysis, add Avg. Disk sec/Read and Avg. Disk sec/Write explicitly rather than relying on disk byte counters.
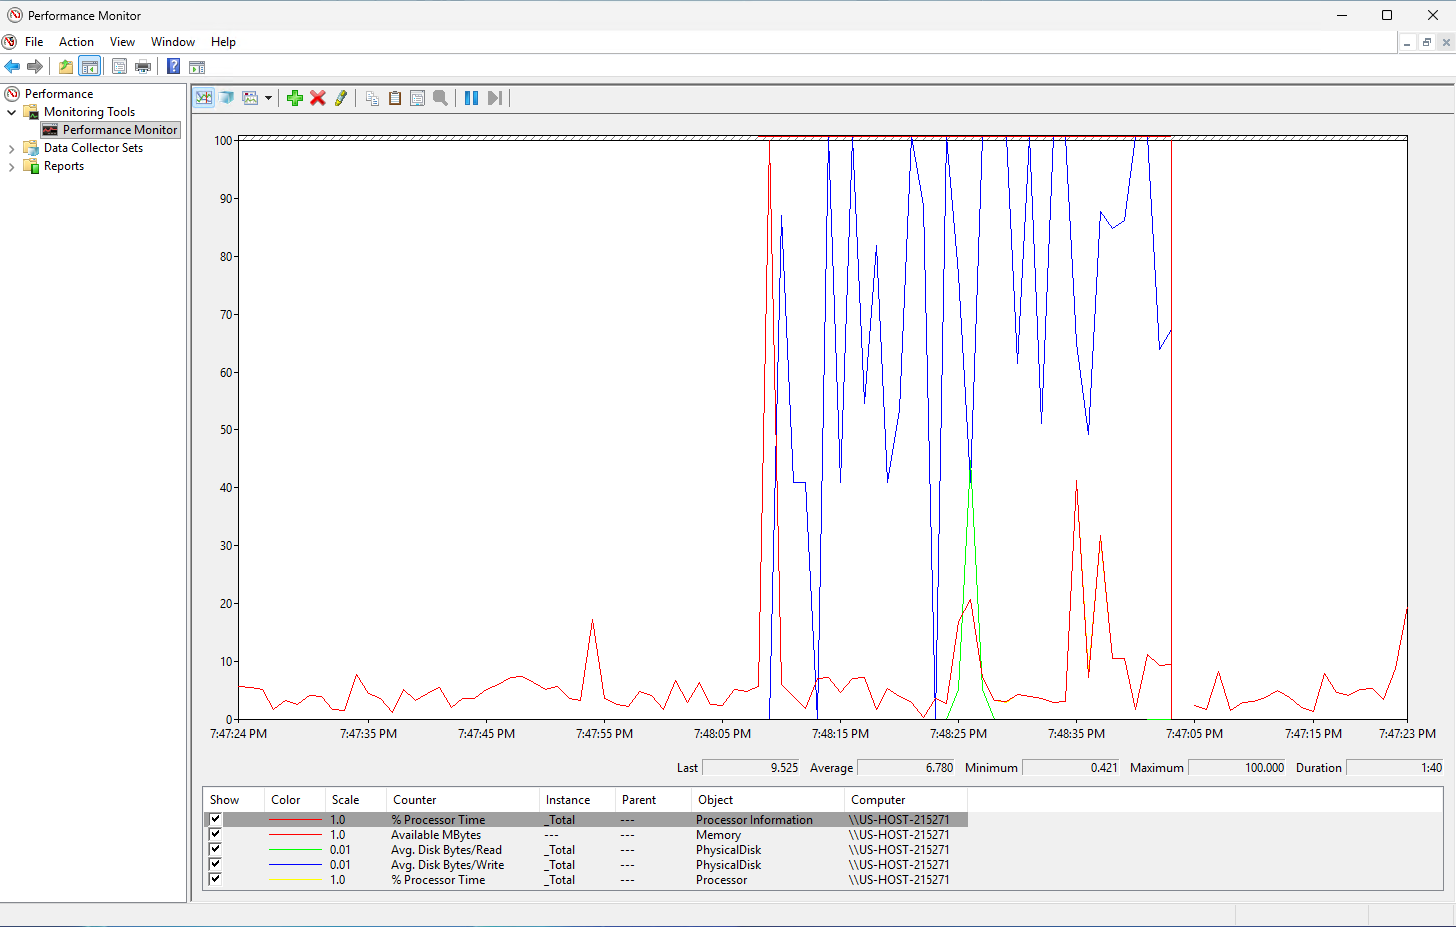
Windows Performance Monitor during the controlled SQL Server baseline session on Raff.
Do not duplicate the entire Windows PerfMon setup here. The canonical workflow for Task Manager, Resource Monitor, PerfMon, and Data Collector Sets is Windows Server Performance Monitoring.
For this SQL article, the key requirement is time alignment: collect the Windows counters during the same interval you are reviewing in Query Store.
A practical 30–60 minute baseline workflow
For a small production SQL Server or a controlled test environment, use this sequence:
- Record SQL Server version, VM role, and current workload.
- Verify Query Store state and wait-stat capture.
- Note the baseline start time.
- Start a Windows PerfMon/Data Collector Set or equivalent monitoring window.
- Run or observe a representative workload.
- Review Query Store Top Resource Consuming Queries.
- Review Regressed Queries if relevant.
- Review Query Store wait categories.
- Capture instance-level wait stats for the interval or compare before/after snapshots.
- Review SQL memory/performance counters.
- Stop the monitoring window.
- Correlate the timestamps before deciding what to change.
Do not use a synthetic workload to claim production performance. A lab validates the procedure; production sizing still requires the customer’s real workload.
Baseline worksheet
Keep a short record for each measurement window:
| Field | Example format |
|---|---|
| Window | 14:00–14:45 UTC |
| Workload | Normal business load / month-end report / import job |
| SQL version | SQL Server version and build |
| Database | Test or production database identifier |
| Query Store state | Read write / read only / off |
| Top query signal | CPU / duration / reads / executions |
| Dominant query wait category | Category from Query Store |
| Instance wait change | Largest meaningful delta during window |
| Windows CPU | Normal pattern and peak during window |
| Available memory | Trend during window |
| Disk latency | Read/write trend during window |
| SQL memory signal | Total vs target server memory, other relevant counter |
| Change made | None / query change / config change / resize |
| Result | Better / unchanged / worse after re-test |
This makes future incidents much easier to compare with known-good behavior.
When to tune the query and when to resize the Windows VM
A performance baseline should prevent unnecessary infrastructure upgrades as much as it should identify legitimate capacity limits.
| Evidence | First action |
|---|---|
| One or two queries dominate CPU while Windows still has headroom | Investigate query plan, indexes, application pattern |
| Query regression appears after plan change | Investigate the regressed plan before resizing |
| SQL memory is capped too low while Windows has available memory | Review MSSQL Memory Tuning |
| Windows has persistent memory pressure and SQL plus other services compete | Tune memory allocation and consider more RAM or role separation |
| TempDB pressure aligns with workload | Review Configure TempDB for MSSQL Performance |
| Disk latency rises with database I/O during the incident | Investigate query I/O, maintenance overlap, storage path, then infrastructure capacity |
| CPU is persistently saturated across the representative workload after query review | Consider additional vCPU or workload separation |
| Server hosts IIS/RDS/SQL and workloads compete repeatedly | Consider splitting roles instead of only enlarging one mixed VM |
For role-level CPU/RAM planning, use Windows Server Sizing by Workload.
Query Store regressions should be investigated before plan forcing
Query Store can make plan regressions visible and supports plan forcing, but plan forcing should not be the first reflex.
Before forcing a plan, document:
- the query ID;
- old and new plan behavior;
- runtime and resource differences;
- whether statistics, indexes, compatibility level, application parameters, or schema changed;
- whether the old plan is still safe for current data distribution and workload.
Plan forcing can be a useful stabilization tool, but it is still a production change that needs validation and a rollback path.
Do not tune from Page Life Expectancy alone
Page Life Expectancy is frequently treated as a pass/fail number. That is too simplistic.
PLE can move because of:
- workload changes;
- scans;
- cache churn;
- memory configuration;
- database size;
- maintenance jobs;
- concurrent workloads.
Use its trend with Windows available memory, SQL total/target memory, query behavior, and workload timing. If memory is the actual bottleneck, the dedicated MSSQL Memory Tuning guide owns the configuration decision.
Do not treat one disk-latency number as a universal threshold
Disk behavior depends on workload, storage architecture, request size, read/write mix, caching, and concurrency.
Instead of writing one number into a runbook as “healthy,” compare:
- known-good window;
- slow window;
- backup or maintenance window;
- before/after a query or infrastructure change.
The change in latency aligned with the SQL workload is usually more actionable than a generic threshold copied from another environment.
SQL Server baseline vs Windows Server baseline
These pages are intentionally separate canonical owners.
This article owns:
- Query Store;
- query regressions;
- Query Store wait categories;
sys.dm_os_wait_statsas supporting SQL evidence;- SQL Server performance counters;
- correlation between SQL and Windows metrics.
Windows Server Performance Monitoring owns:
- generic Windows CPU monitoring;
- generic memory monitoring;
- generic disk/network monitoring;
- PerfMon/Data Collector Set setup independent of SQL Server.
This keeps the SQL content useful without creating a competing generic PerfMon article.
Where Raff fits
Raff Windows VMs can host self-managed SQL Server workloads where administrators need control of the Windows Server operating system, SQL Server configuration, storage layout, firewall rules, backups, and performance diagnostics.
A practical architecture for a growing workload is:
Application / IIS VM
        ↓
Private network
        ↓
SQL Server VM
        ↓
Query Store + SQL metrics + Windows monitoring
For a small workload, SQL Server and the application may start on one Windows VM. If baseline evidence shows that the roles repeatedly compete for CPU, RAM, or storage, separating the application and database can create a cleaner scaling and troubleshooting path.
Raff provides the infrastructure layer. Query tuning, indexing, SQL Server configuration, licensing, database administration, and application behavior remain administrator responsibilities unless a separate managed service explicitly covers them.