
In short
Use Windows Server performance monitoring to find the bottleneck before you resize or tune the server. Start with Task Manager for a quick check, Resource Monitor for process-level investigation, and Performance Monitor (PerfMon) for historical counters. Track CPU, available memory, paging, disk latency, network activity, and the application itself during both normal and peak workload periods.
Windows Server performance monitoring starts with a baseline
A slow Windows Server does not automatically need more vCPU or RAM. The bottleneck may be CPU pressure, memory paging, storage latency, network conditions, a single process, or the application itself.
The useful workflow is:
Measure normal workload
→ capture the slow period
→ identify the constrained resource
→ change one variable
→ measure again
Record the baseline before users report a problem whenever possible. A single Task Manager screenshot taken after the incident usually cannot explain what happened five minutes or two hours earlier.
Microsoft's current Windows Server troubleshooting guidance recommends collecting performance counters over time when a problem is intermittent or cannot be observed live.
Task Manager, Resource Monitor, and PerfMon have different jobs
Windows Server includes several built-in monitoring tools. They overlap, but they are not interchangeable.
| Tool | Best use | Limitation |
|---|---|---|
| Task Manager | Fast current-state CPU, memory, disk, network, and process checks | Little historical context |
| Resource Monitor | Process-level CPU, memory, disk, and network investigation | Primarily live troubleshooting |
| Performance Monitor (PerfMon) | Historical counters, baselines, Data Collector Sets, reports | Requires choosing useful counters and a collection window |
perfmon /report | Quick System Diagnostics report | Point-in-time diagnostic, not continuous monitoring |
logman.exe | Scriptable creation/start/stop of Data Collector Sets | Command-line workflow requires planning the counter set |
Use the simplest tool that answers the question. Move to PerfMon when the problem is intermittent, happens during peak hours, or needs evidence before a resize decision.
Performance Monitor provides the historical view
Performance Monitor is built into supported Windows Server releases, including Windows Server 2025, 2022, and 2019.
Open it from Run or a terminal:
perfmon
Microsoft documents PerfMon as the Windows interface for real-time performance counters, Data Collector Sets, and reports. The command also supports modes such as:
perfmon /res
perfmon /report
perfmon /sys
/resopens Resource View./reportruns the System Diagnostics Data Collector Set and displays its report./sysopens Performance Monitor.
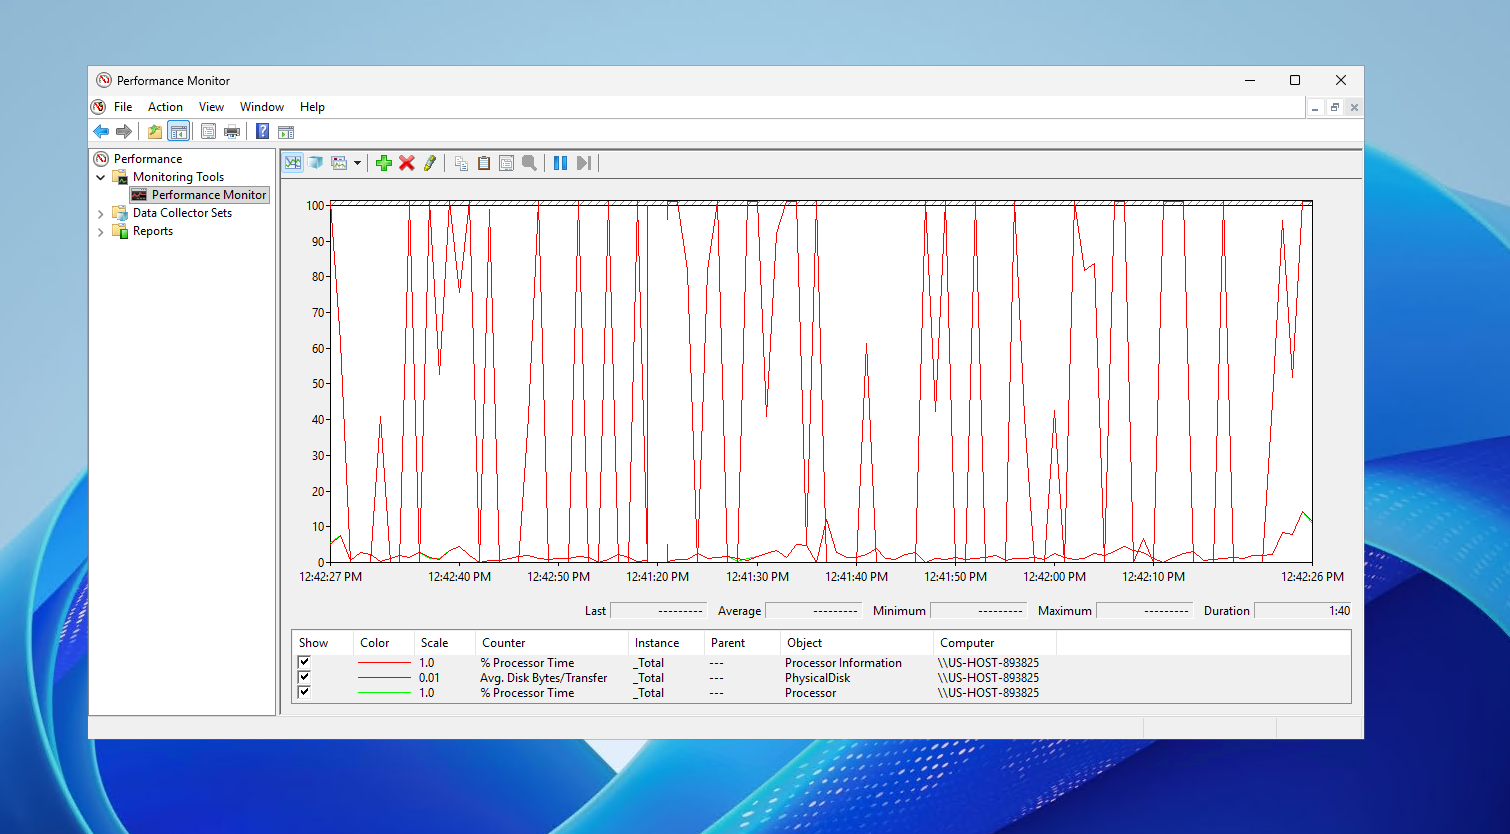
The existing Raff screenshot below shows PerfMon with CPU, memory, disk, and network counters on a Windows VM.
CPU monitoring separates short bursts from sustained compute pressure
CPU spikes during logon, Windows Update, backups, application startup, antivirus scans, report generation, or deployments can be normal. The more important question is whether CPU remains constrained during the workload users care about.
Useful counters include:
| Counter | What it helps answer |
|---|---|
Processor Information(_Total)\% Processor Time | Is overall CPU busy during the incident? |
System\Processor Queue Length | Is runnable work waiting for CPU time? |
Process(*)\% Processor Time | Which process is consuming CPU? |
Do not diagnose a CPU bottleneck from one high sample. Correlate sustained CPU activity with queueing, the responsible process, and the time users experienced slowness.
If one application owns most of the CPU, application tuning may be more valuable than increasing VM size.
Memory monitoring shows pressure before users feel it as slowness
Windows Server can appear CPU- or disk-bound when the real problem is memory pressure and paging.
Useful counters include:
| Counter | What it shows |
|---|---|
Memory\Available MBytes | Remaining physical memory headroom |
Memory\Pages/sec | Paging activity that needs interpretation with the workload |
Process(*)\Working Set | Approximate physical memory used by individual processes |
Memory\Committed Bytes | Memory committed by the operating system and applications |
Microsoft's troubleshooting guidance uses available memory as an important health signal, but a production sizing decision should not rely on one universal percentage. A 4 GB application VM and a 64 GB SQL Server have very different acceptable operating patterns.
For SQL Server, IIS, and RDS, interpret system memory together with workload-specific counters. If SQL Server intentionally uses most available RAM, for example, review its configured memory limit before assuming Windows itself needs more memory.
Disk monitoring focuses on latency and workload timing
A VM can show moderate CPU and plenty of RAM while users still experience slow application launches, logons, reports, or database activity because storage is the bottleneck.
Useful counters include:
| Counter | What it helps diagnose |
|---|---|
PhysicalDisk(*)\Avg. Disk sec/Transfer | Read/write response time seen by Windows |
PhysicalDisk(*)\Current Disk Queue Length | Requests waiting on the disk path |
PhysicalDisk(*)\Disk Transfers/sec | Storage I/O rate |
LogicalDisk(*)\% Free Space | Capacity pressure |
Measure the disk during the slow workload. A quiet server at 03:00 does not tell you whether storage becomes the limiting resource during a 09:00 login surge, nightly backup, SQL report, or application batch job.
Raff Windows VMs use NVMe-backed storage, but the application can still create an I/O bottleneck through database behavior, profile growth, concurrent users, logging, backups, or too many workloads sharing the same VM.
Network monitoring separates server pressure from connection problems
Remote Desktop and distributed business applications depend on both server resources and the network path.
Useful counters include:
Network Interface(*)\Bytes Total/sec;- network-interface errors where applicable;
- application connection failures;
- latency and packet loss measured from the user location;
- RDP-specific behavior for Remote Desktop workloads.
If only one branch or one user reports a slow Remote Desktop session while CPU, RAM, and disk remain normal, investigate the client network, Wi-Fi, routing, packet loss, display settings, and endpoint before resizing the server.
Use RDP Performance Tuning when the workload is specifically Remote Desktop.
Data Collector Sets capture the problem when nobody is watching
PerfMon becomes much more useful when counters are collected automatically.
A Data Collector Set groups counters and records them at a chosen interval. Microsoft supports creating these sets through the Performance Monitor interface or with logman.exe.
A simple GUI workflow is:
- Open Performance Monitor.
- Expand Data Collector Sets.
- Open User Defined.
- Create a new Data Collector Set.
- Add CPU, memory, disk, network, and workload-specific counters.
- Choose a collection interval appropriate for the problem.
- Start the collector before the expected slow period.
- Stop it after the incident and review the resulting report/log.
For a recurring issue, historical capture is usually more useful than repeatedly opening Task Manager and hoping the problem happens while you are looking.
Logman can automate a basic PerfMon capture
For administrators who prefer a repeatable command-line workflow, Windows includes logman.exe.
The following example creates a small baseline collector that records common counters every 15 seconds:
logman create counter "Raff-Server-Baseline" ^
  -o "C:\PerfLogs\Raff-Server-Baseline.blg" ^
  -f bin ^
  -v mmddhhmm ^
  -c "\Processor Information(_Total)\% Processor Time" ^
     "\Memory\Available MBytes" ^
     "\Memory\Pages/sec" ^
     "\PhysicalDisk(_Total)\Avg. Disk sec/Transfer" ^
     "\Network Interface(*)\Bytes Total/sec" ^
  -si 00:00:15
Start and stop the collector with:
logman start "Raff-Server-Baseline"
logman stop "Raff-Server-Baseline"
Microsoft's own troubleshooting examples use logman.exe for longer-running PerfMon captures and vary the sampling interval based on the problem. A short interval gives more detail but also produces more data; a long-running baseline can usually use a less aggressive interval than a short incident capture.
Workload counters matter as much as operating-system counters
CPU, RAM, disk, and network counters tell you where pressure appears. The application explains why.
IIS workloads need request and worker-process context
Review:
- CPU and memory by
w3wp.exeprocess; - application-pool behavior;
- request latency and error rate;
- queueing;
- application logs;
- recycle events.
If IIS is the bottleneck, continue with IIS Application Pool Tuning rather than treating the server as a generic CPU problem.
SQL Server workloads need database context
Review:
- SQL Server memory configuration;
- database file latency;
- expensive queries;
- waits and blocking;
- backup activity;
- SQL Server process CPU and memory.
If Windows shows memory pressure while SQL Server consumes most RAM, use MSSQL Memory Tuning before adding memory blindly.
Remote Desktop workloads need session context
Review:
- peak concurrent sessions;
- CPU during login waves;
- memory per active session;
- profile growth;
- storage activity during logon/logoff;
- latency and packet loss from user locations.
For capacity planning, use Windows VPS Sizing for Remote Users.
File servers need storage and SMB context
Review:
- capacity growth;
- disk latency;
- file-operation patterns;
- SMB activity;
- backup windows;
- antivirus or indexing activity during the incident.
Monitoring data should decide whether the VM is resized
A resize is justified when the measurements repeatedly show that the VM resource itself is the constraint.
| Finding | Better next action |
|---|---|
| CPU remains constrained during normal peak workload | Tune the responsible process or add vCPU |
| Available memory repeatedly falls too low and paging coincides with slowness | Tune application memory or add RAM |
| Disk latency rises during the incident | Investigate I/O pattern, storage layout, database/app behavior, or workload separation |
| Only remote users are affected | Investigate latency, packet loss, RDP settings, and client path |
| One process creates most pressure | Tune or isolate the application before resizing everything |
| Multiple heavy roles compete on one VM | Consider splitting SQL, RDS, IIS, or other roles |
The goal is not the largest Windows VM. It is the smallest configuration that gives the workload enough headroom during real peak usage.
For a fresh deployment or resize, compare Raff Windows VM plans after identifying the constrained resource.